Simulations, Regressions, and Significance

Stijn Masschelein

Simulations

Why simulate data?

  • Visualising your theory
  • Experimenting with and understanding statistical tests
  • Experimenting with statistical approaches without peaking at your data

See also Chapter 15 in Huntington-Klein (2021)

Simulating distributions in R

N <- 1000
random <- tibble(
  normal = rnorm(N, mean = 2, sd = 5),
  uniform = runif(N, min = 1, max = 5),
  binomial = rbinom(N, size = 1, prob = .25),
  sample = sample(1:10, size = N, replace = T)
)
glimpse(random)
Rows: 1,000
Columns: 4
$ normal   <dbl> 0.1350883, 6.7537684, 4.7469134, 7.884157…
$ uniform  <dbl> 1.290152, 3.891102, 3.605716, 3.845837, 2…
$ binomial <int> 0, 0, 0, 0, 0, 0, 0, 0, 0, 0, 0, 0, 0, 1,…
$ sample   <int> 1, 8, 8, 2, 3, 8, 6, 10, 7, 5, 10, 2, 3, …
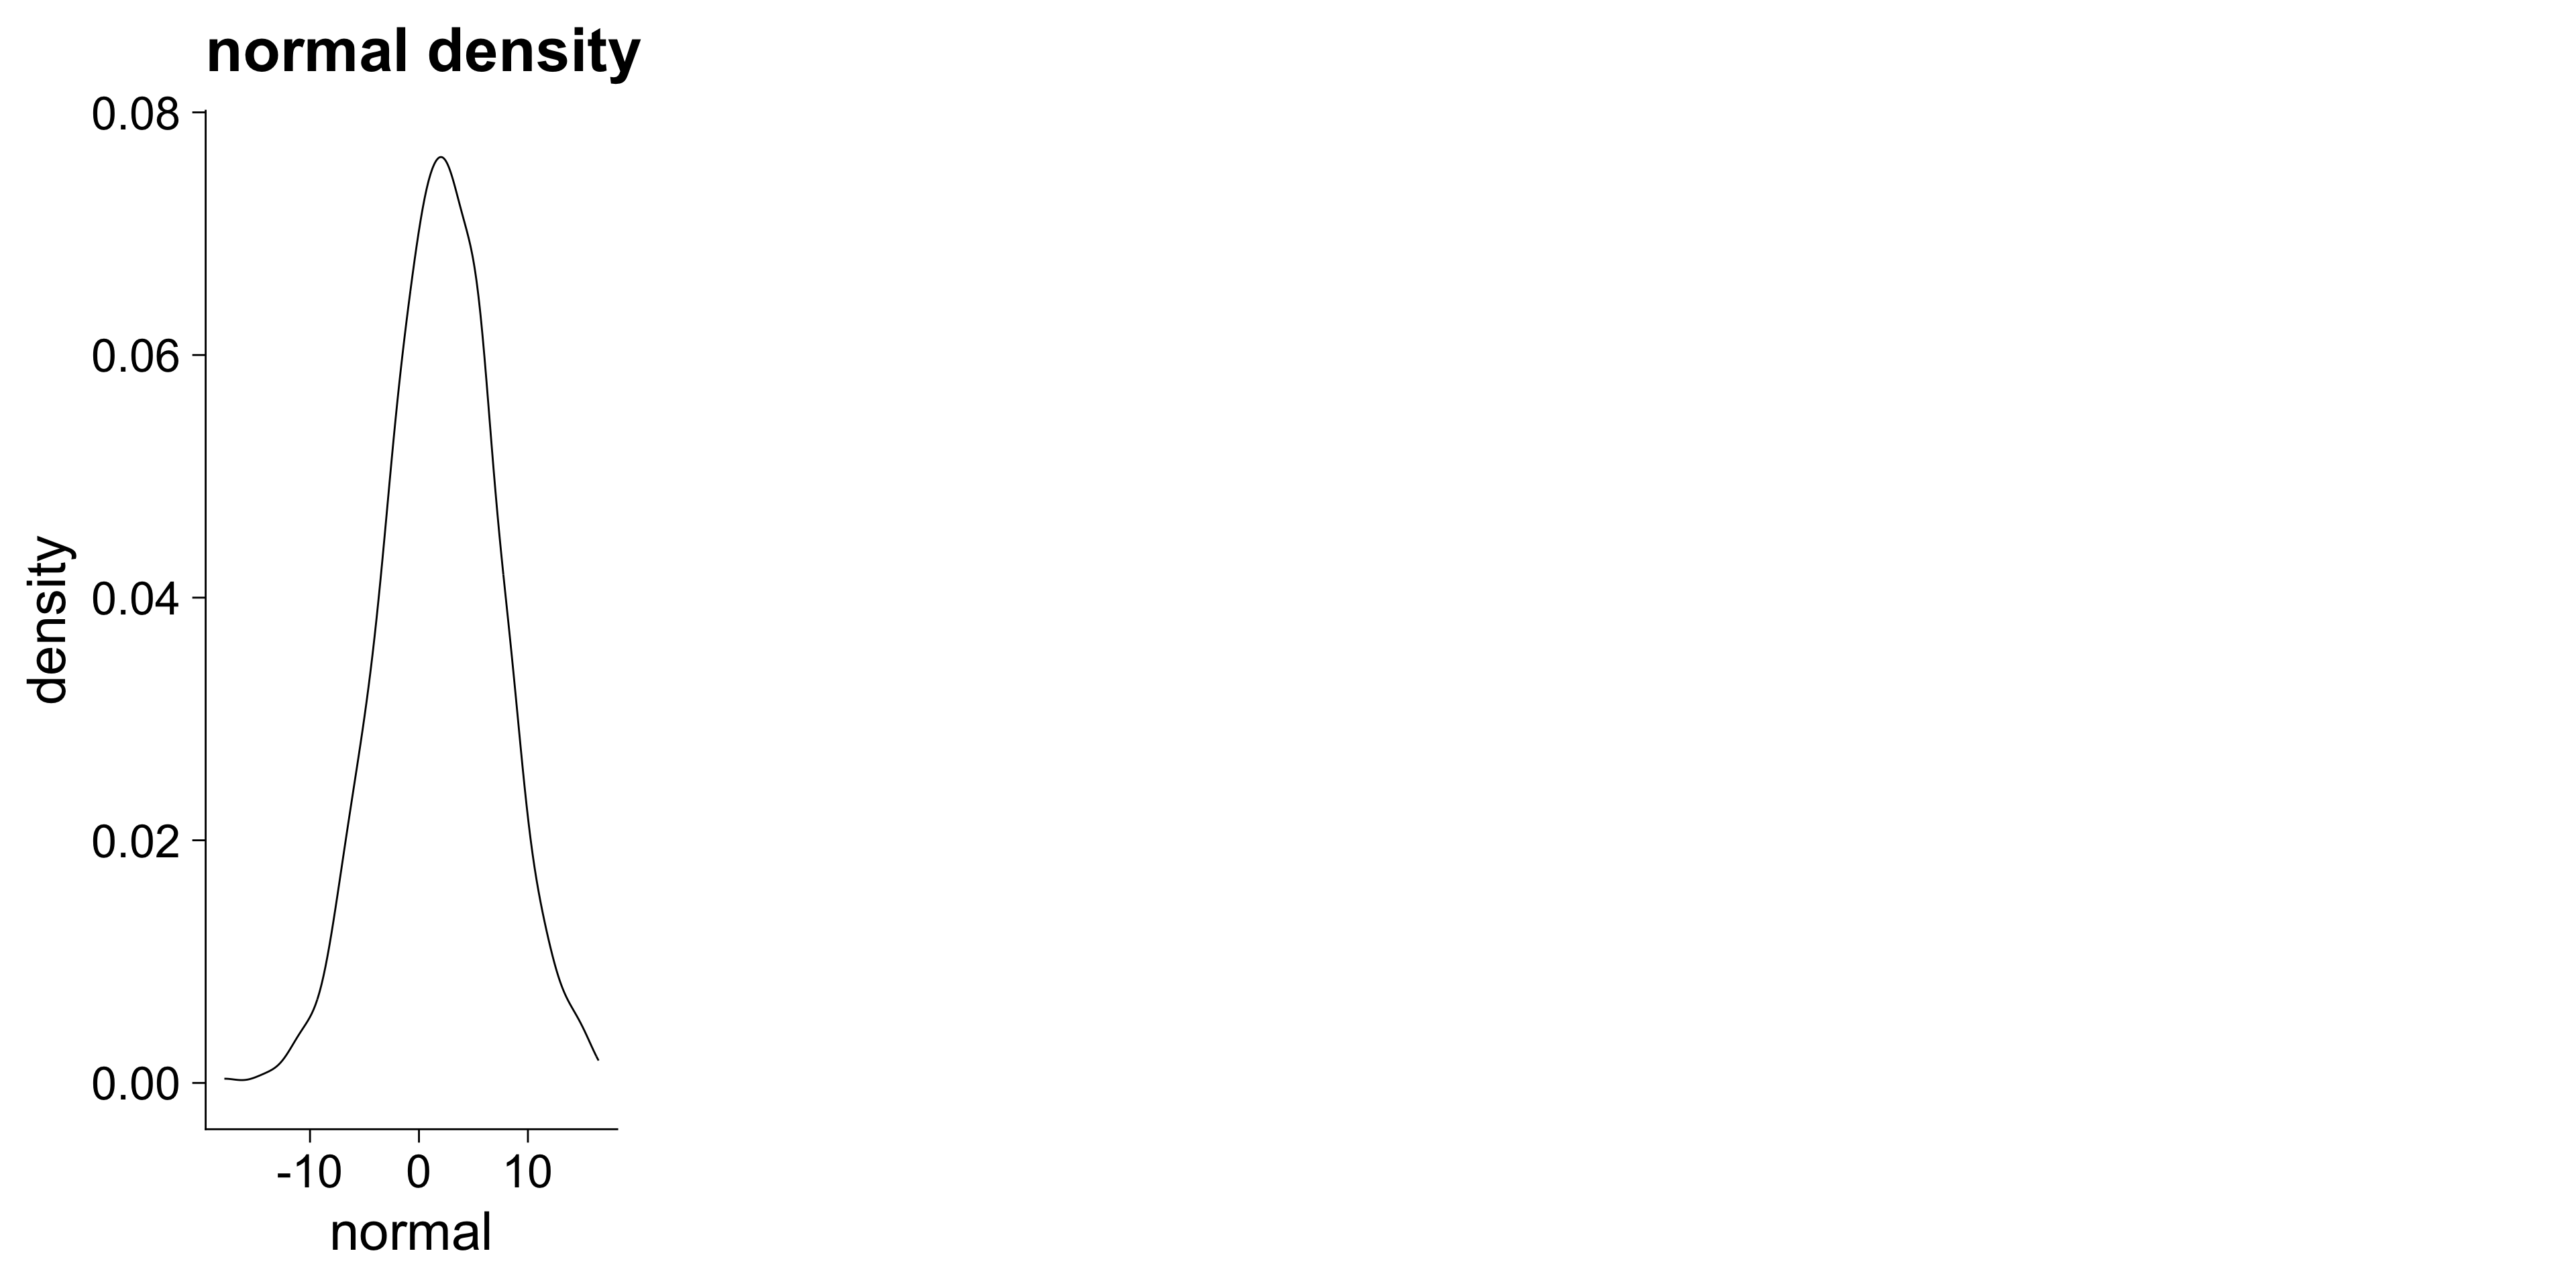
p1 <- ggplot(random, aes(x = normal)) + geom_density() + ggtitle("normal density")
plot_grid(p1, ncol = 4)
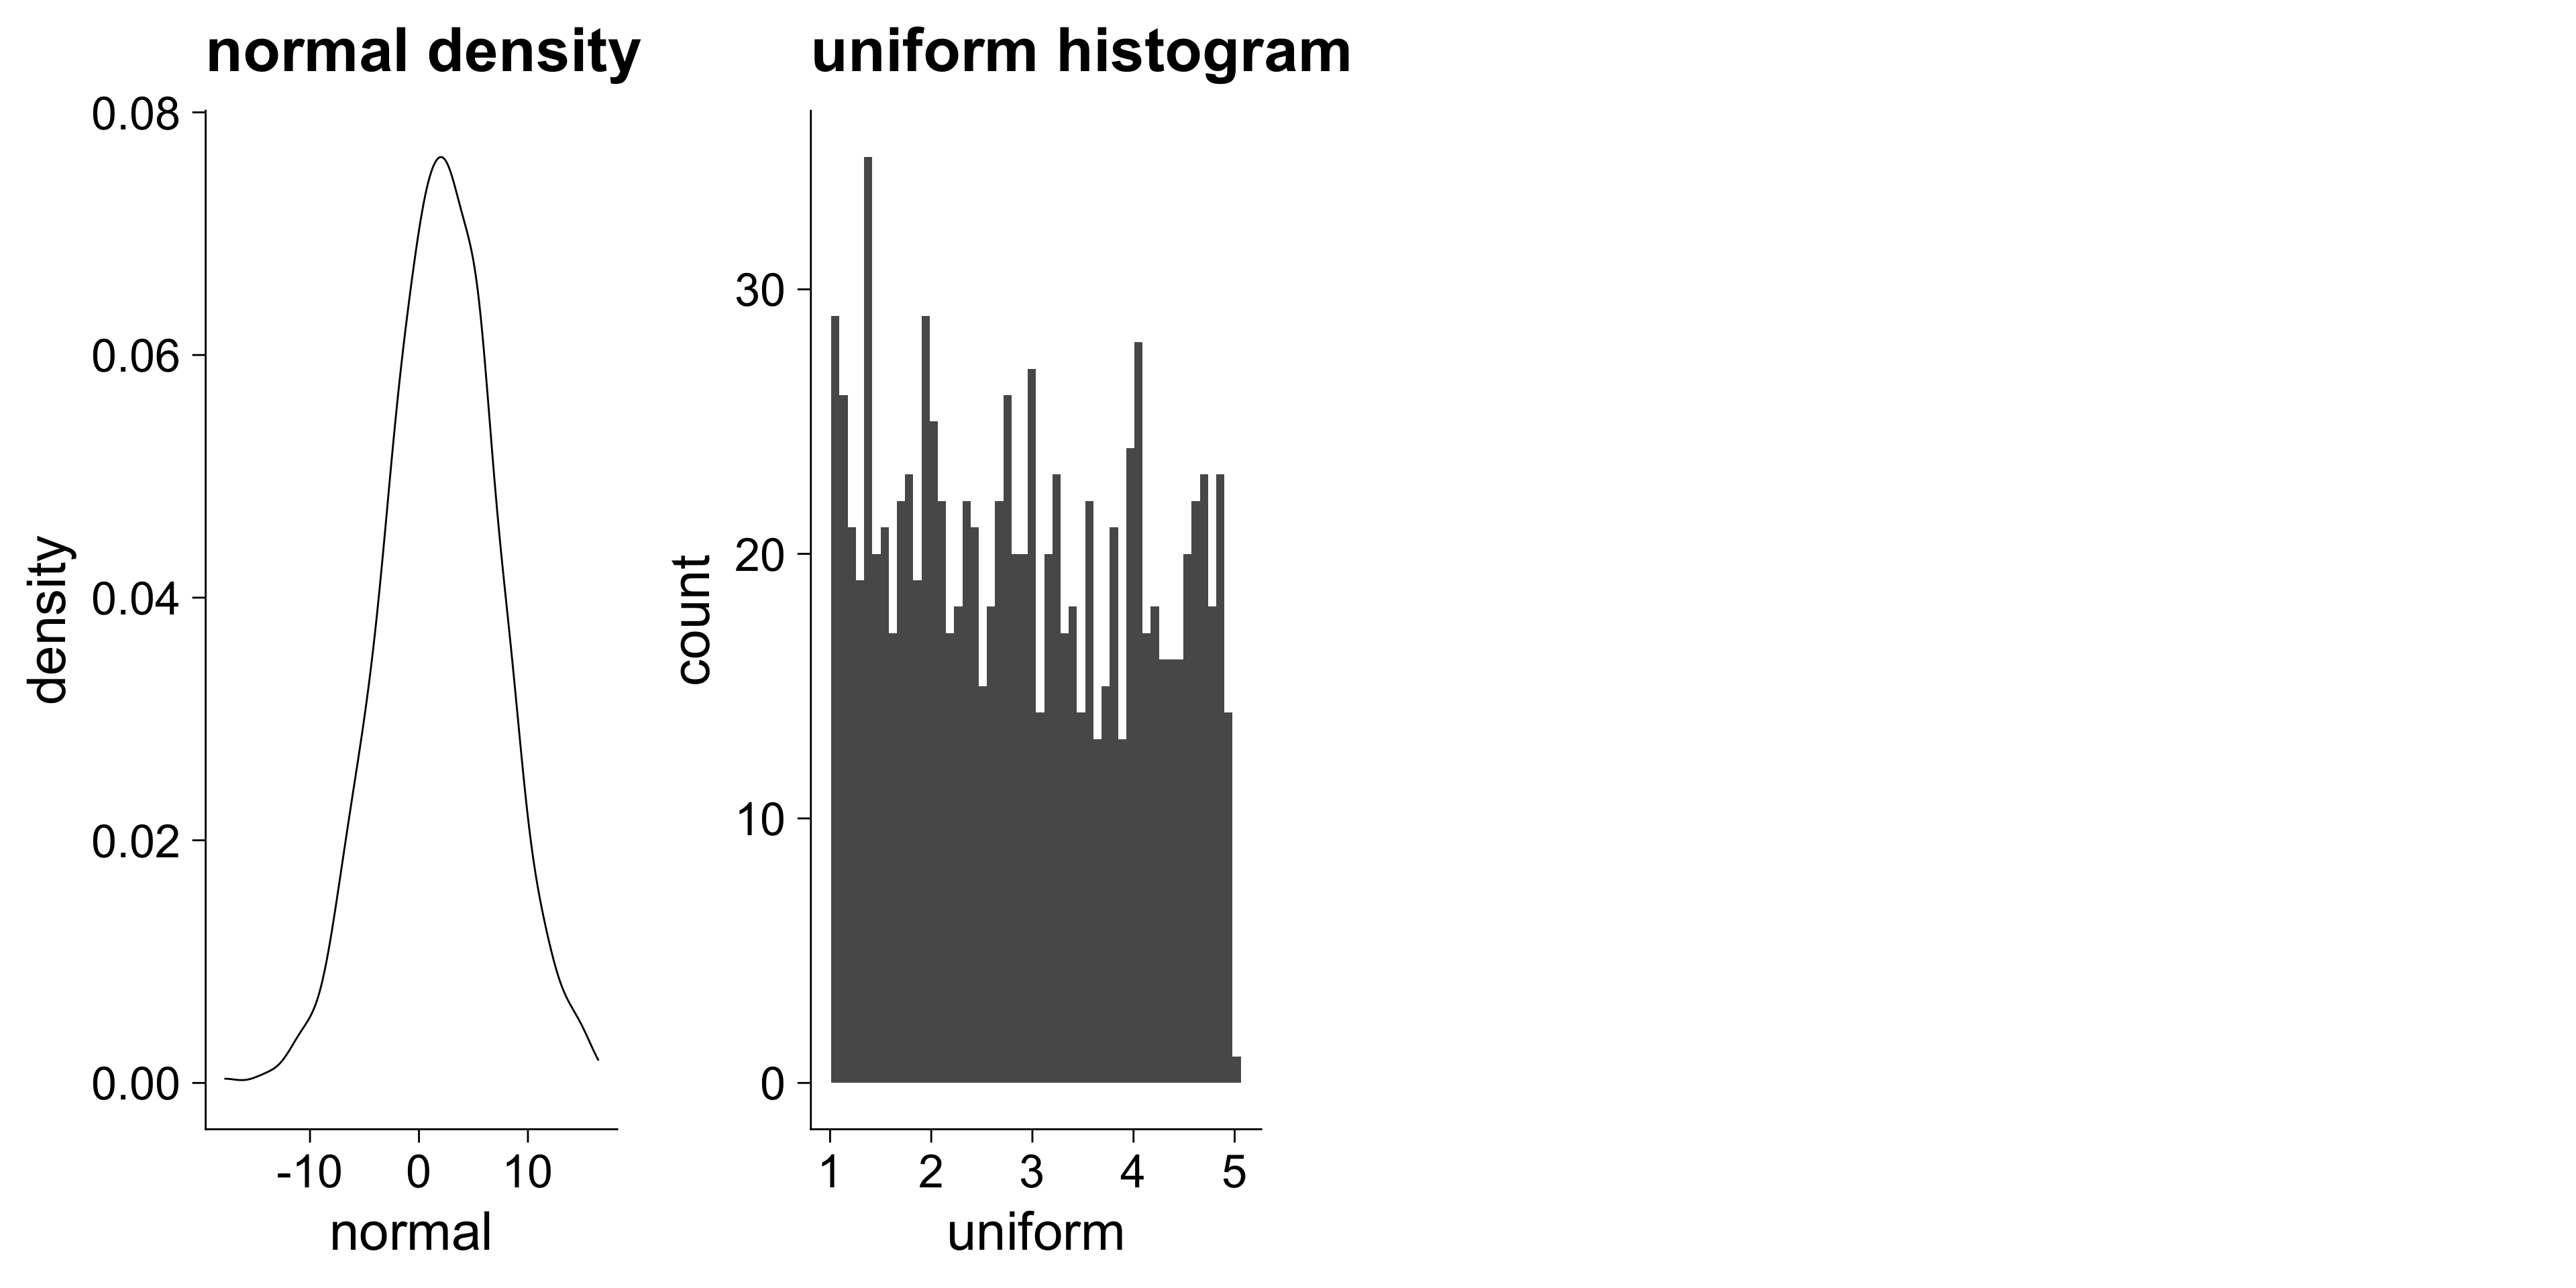
p1 <- ggplot(random, aes(x = normal)) + geom_density() + ggtitle("normal density")
p2 <- ggplot(random, aes(x = uniform)) + geom_histogram(bins = 50) + ggtitle("uniform histogram")
plot_grid(p1, p2, ncol = 4)
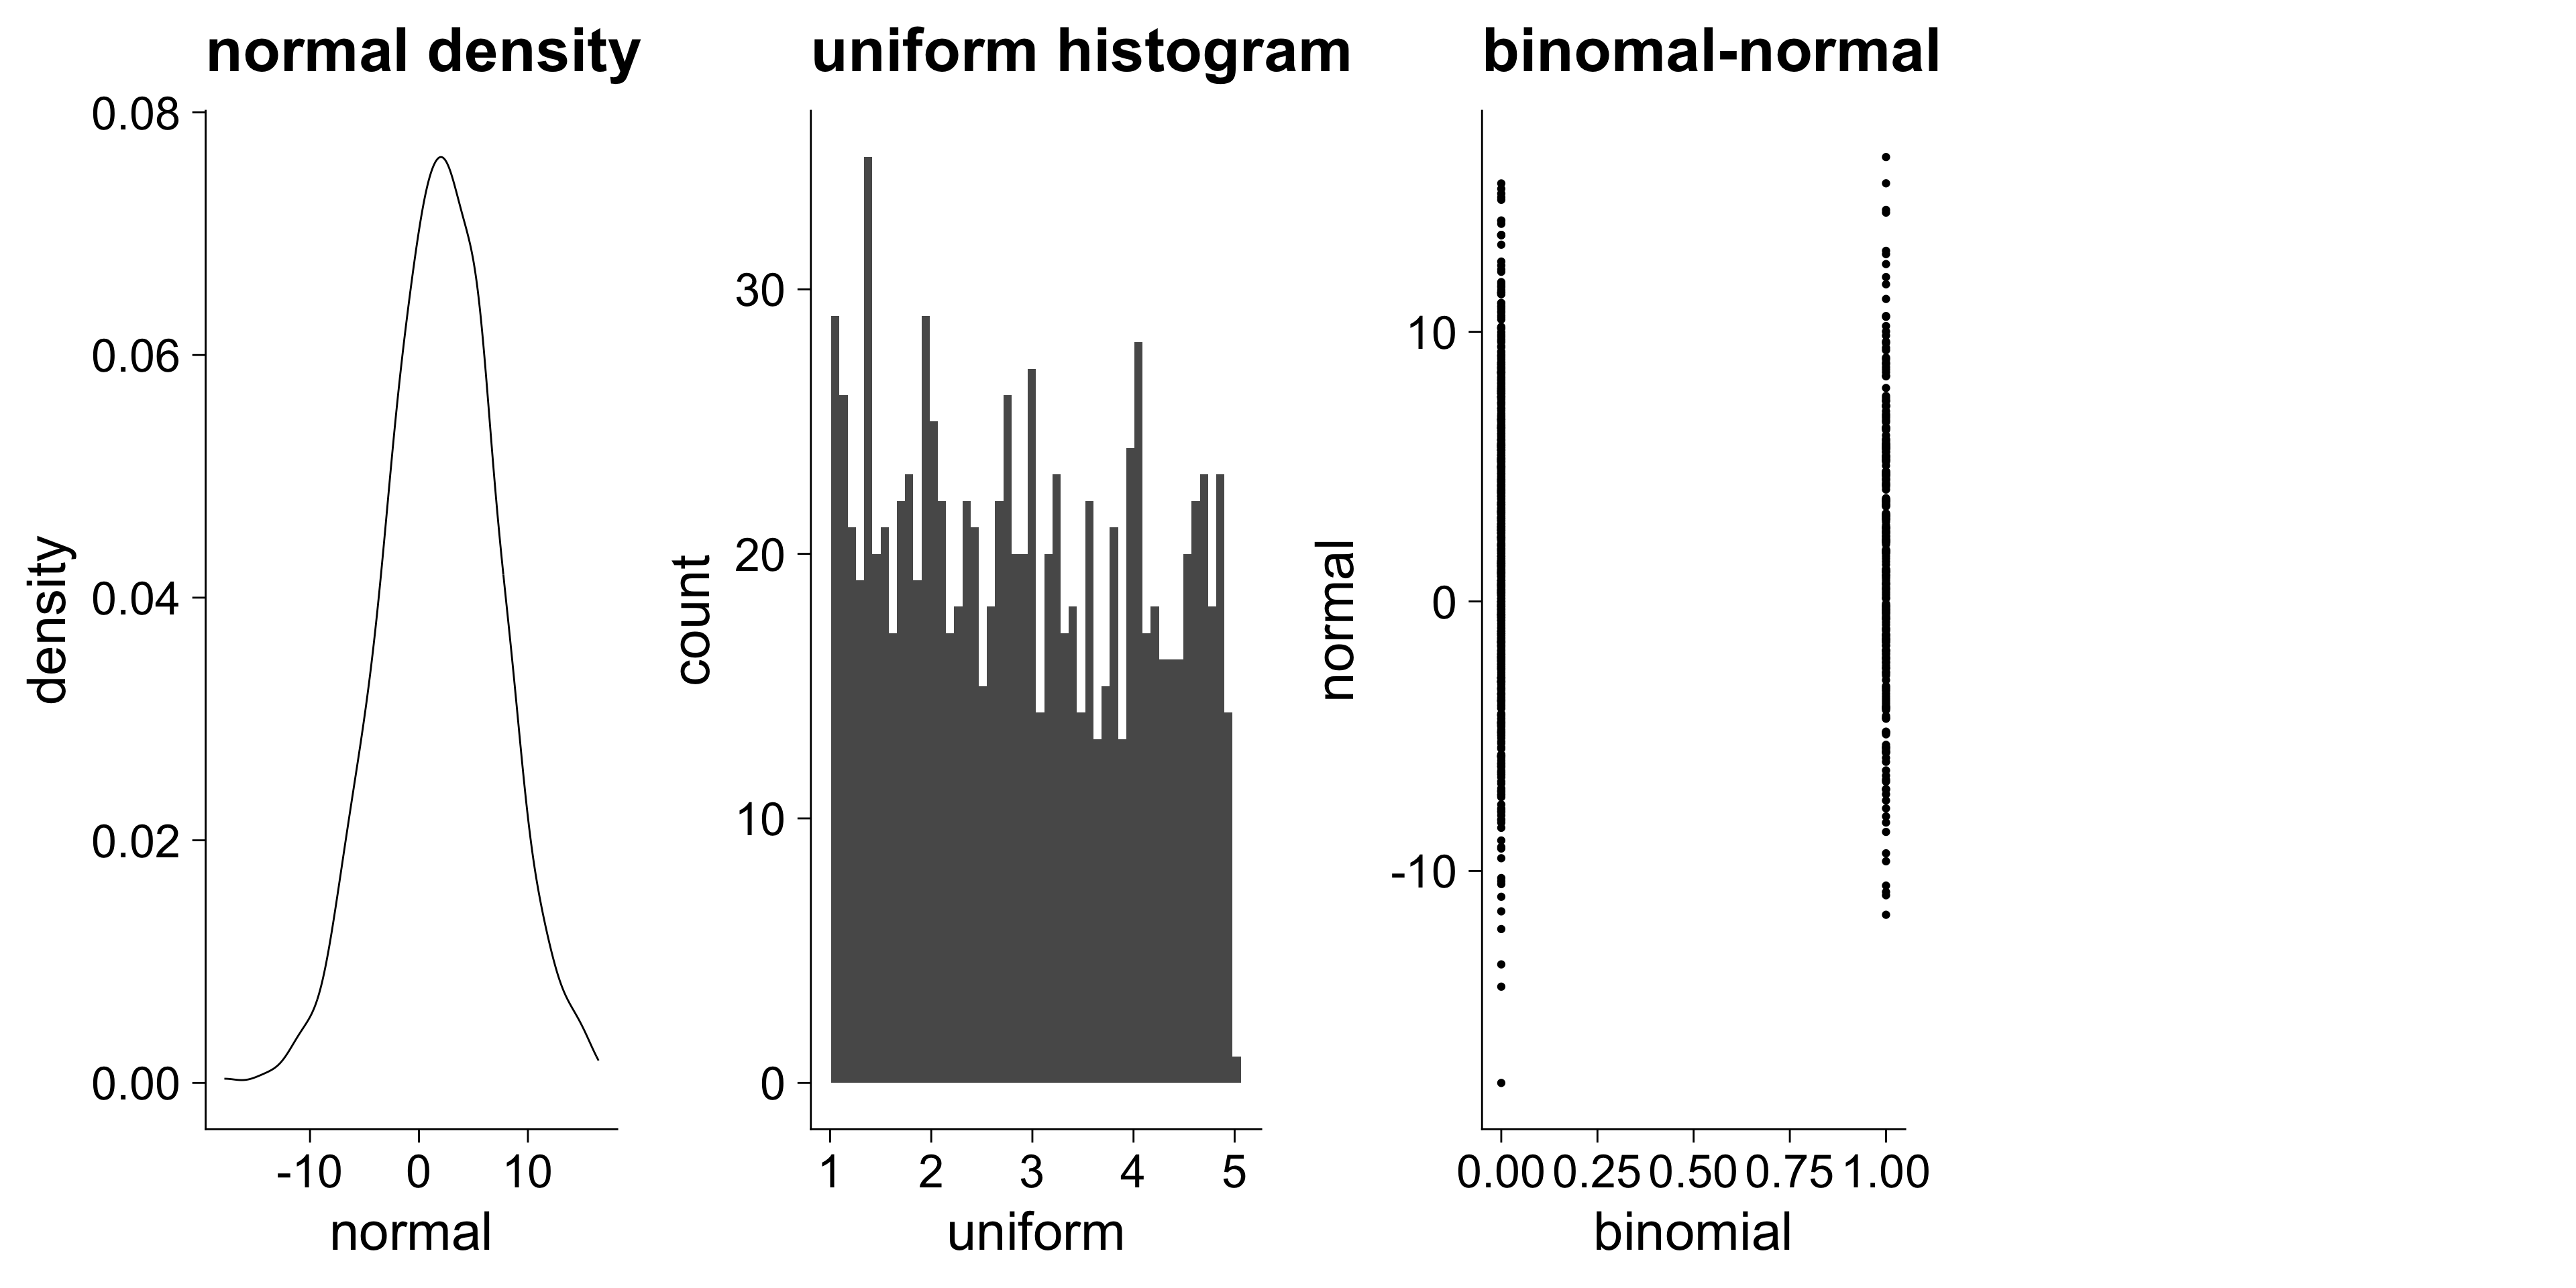
p1 <- ggplot(random, aes(x = normal)) + geom_density() + ggtitle("normal density")
p2 <- ggplot(random, aes(x = uniform)) + geom_histogram(bins = 50) + ggtitle("uniform histogram")
p3 <- ggplot(random, aes(x = binomial, y = normal)) + geom_point() + ggtitle("binomal-normal")
plot_grid(p1, p2, p3, ncol = 4)
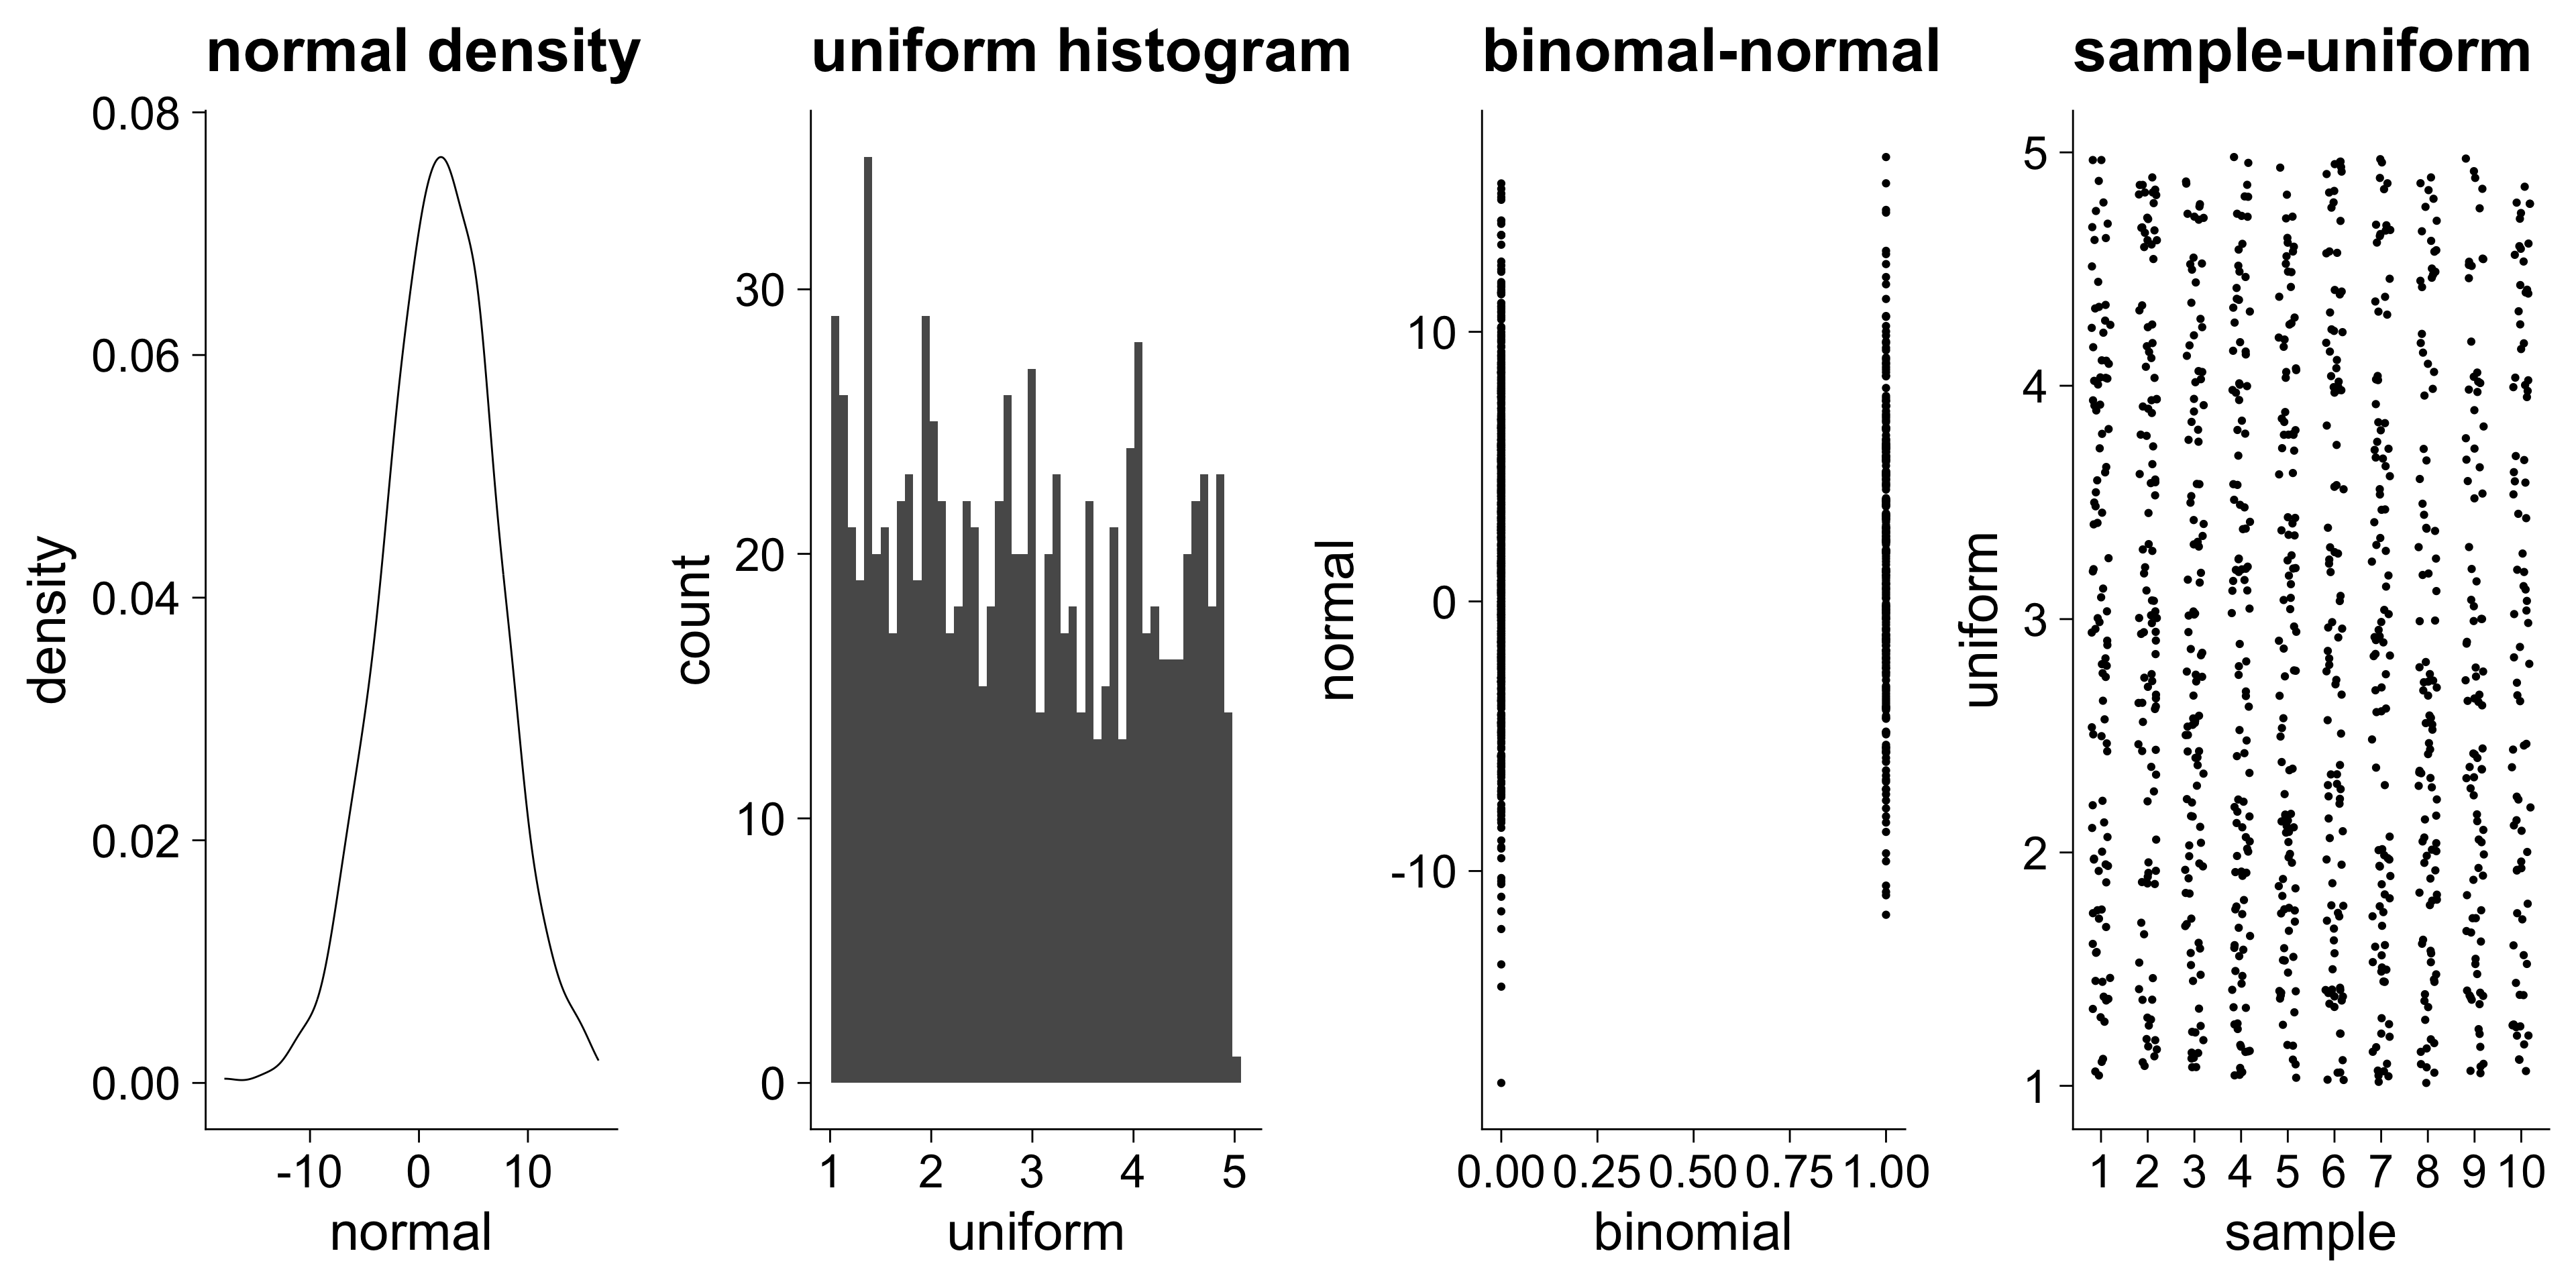
p1 <- ggplot(random, aes(x = normal)) + geom_density() + ggtitle("normal density")
p2 <- ggplot(random, aes(x = uniform)) + geom_histogram(bins = 50) + ggtitle("uniform histogram")
p3 <- ggplot(random, aes(x = binomial, y = normal)) + geom_point() + ggtitle("binomal-normal")
p4 <- ggplot(random, aes(x = as.factor(sample), y = uniform)) + geom_jitter(width = .2) +
    ggtitle("sample-uniform") + labs(x = "sample")
plot_grid(p1, p2, p3, p4, ncol = 4)

Better Code Formatting

p1 <- ggplot(random, aes(x = normal)) +
  geom_density() +
  ggtitle("normal density")
p2 <- ggplot(random, aes(x = uniform)) +
  geom_histogram(bins = 50) +
  ggtitle("uniform histogram")
p3 <- ggplot(random, aes(x = binomial, y = normal)) +
  geom_point() +
  ggtitle("binomal-normal")
p4 <- ggplot(random, aes(x = as.factor(sample), y = uniform)) +
  geom_jitter(width = .2) +
  ggtitle("sample-uniform") + labs(x = "sample")
plot_grid(p1, p2, p3, p4, ncol = 4)

CEO-firm matching

New theory

Summary

  • Firms have different size and CEOs have different talent.
  • More talented CEOs work for bigger firms.
  • Firms pay just enough so that the CEO is not tempted to work for a smaller firm.

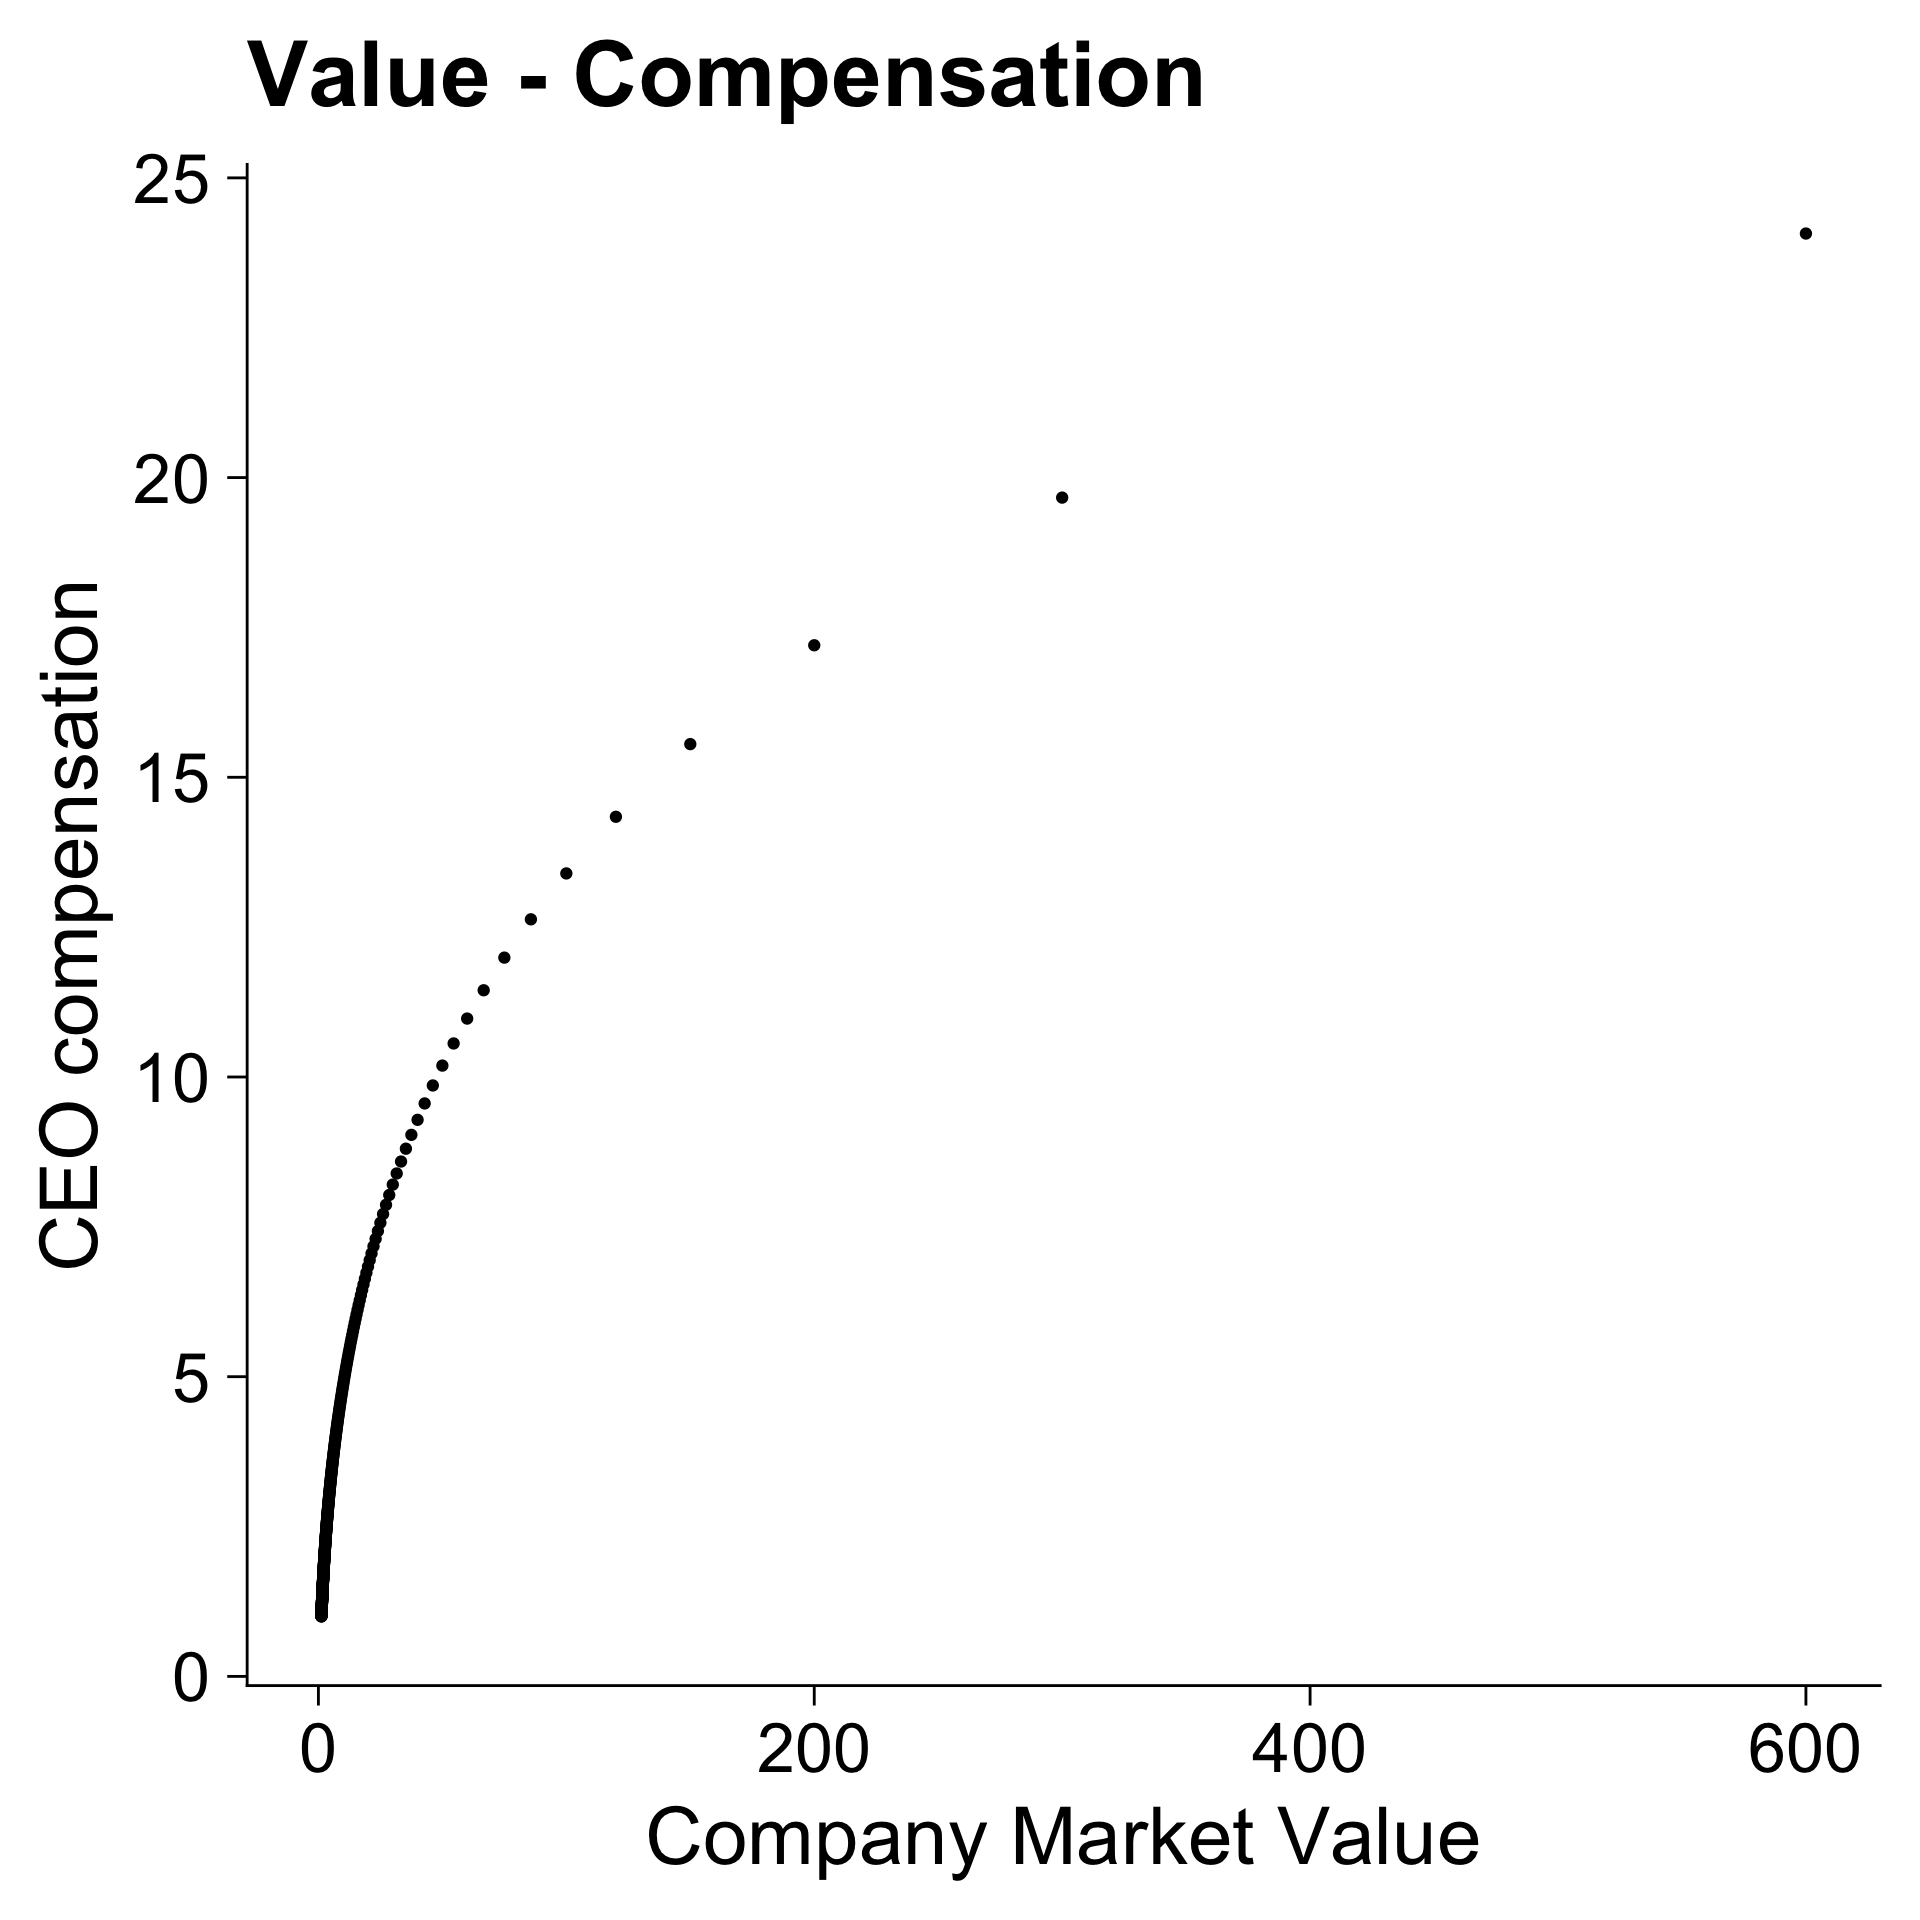
Visualisation of matching theory

Code
obs <- 500
size_rate <- 1; talent_rate <- 2/3;
C <- 1/60; w0 = 1;
n <- c(1:obs)
size <-  600 * n ^ (-size_rate)
talent <- - 1/talent_rate * n ^ (talent_rate)

wage <- rep(NA, obs)
wage[obs] <- w0
for (i in (obs - 1):1){
  wage[i] <- wage[i + 1] + C * size[i + 1] *
      (talent[i] - talent[i + 1])
}

matching_plot <- qplot(x = size, y = wage) +
    labs(x = "Company Market Value", y = "CEO compensation")
plot(matching_plot + ggtitle("Value - Compensation"))

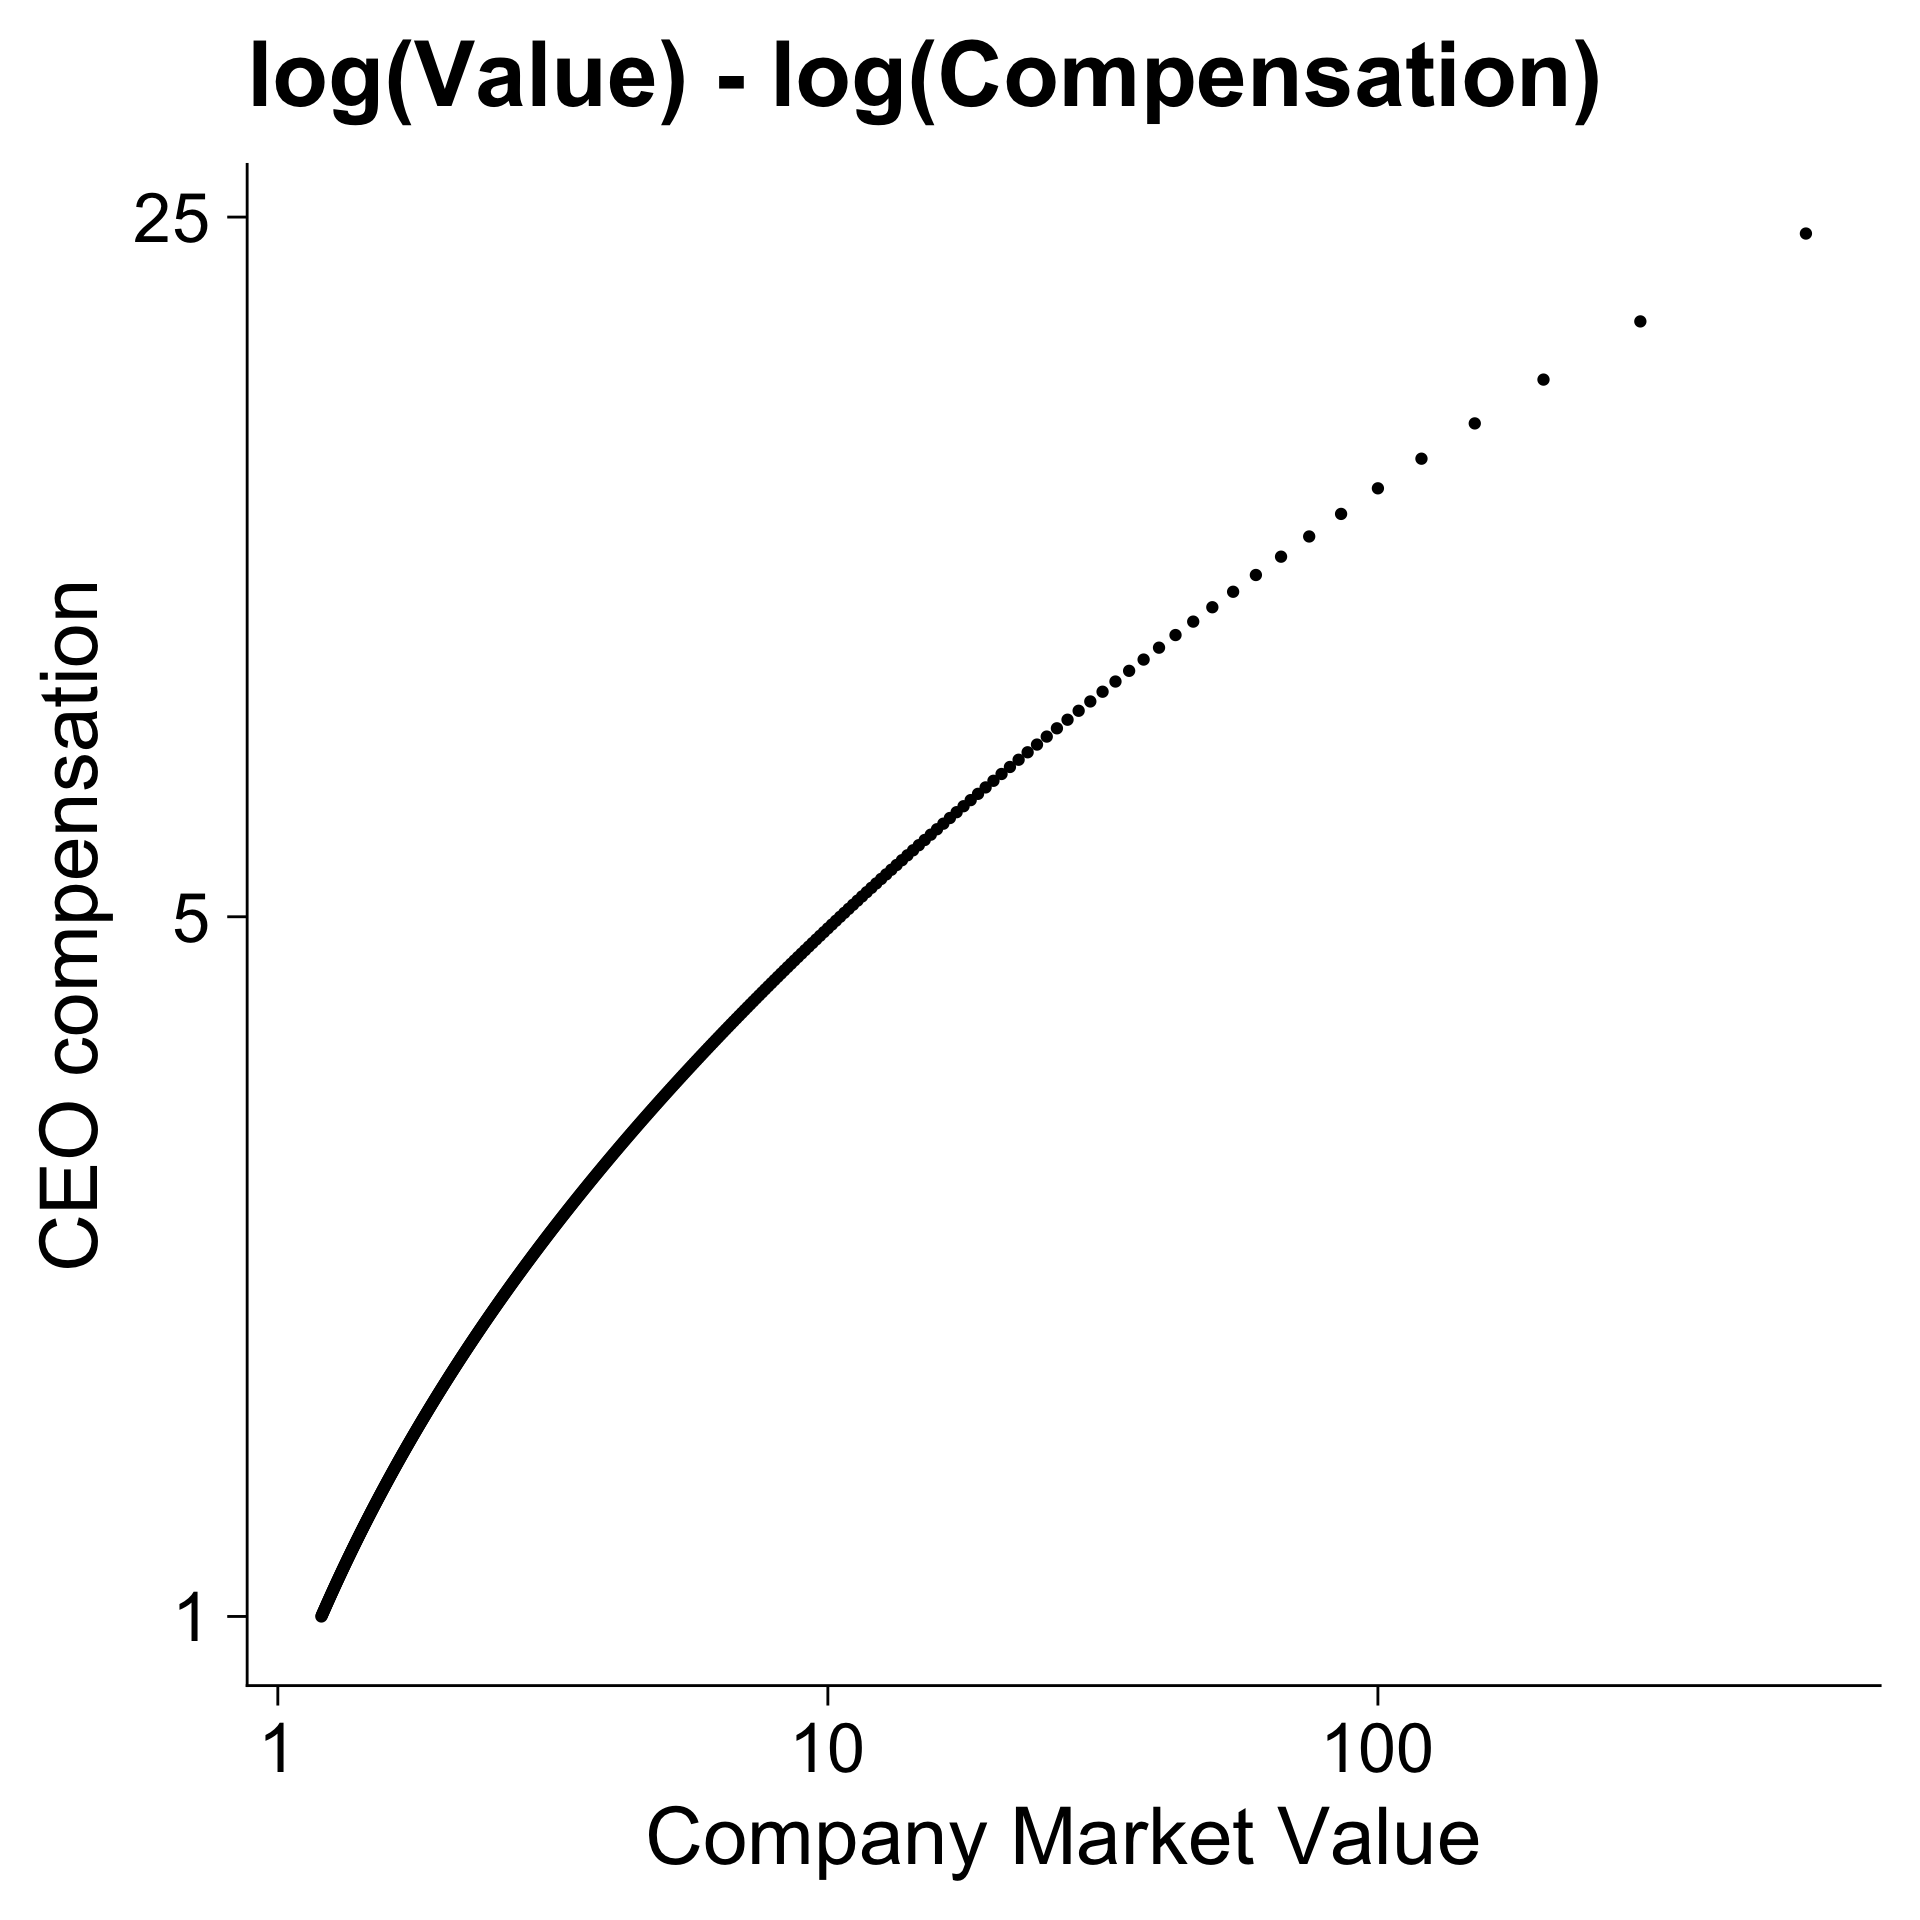
Code
plot(matching_plot +
     scale_x_continuous(trans = "log",
                        breaks = scales::log_breaks(n=5, base=10)) +
     scale_y_continuous(trans = "log",
                        breaks = scales::log_breaks(n=5, base=5)) +
     ggtitle("log(Value) - log(Compensation)")
     )

CEO compensation data

us_comp <- readRDS(here("data", "us-compensation-new.RDS")) %>%
  rename(total_comp = tdc1)
us_value <- readRDS(here("data", "us-value-new.RDS")) %>%
  rename(year = fyear, market_value = mkvalt)
summary(us_value$market_value)
     Min.   1st Qu.    Median      Mean   3rd Qu.      Max. 
      0.0     951.7    2702.9   14756.3    8637.5 2662325.9 
     NA's 
     2792 

Putting it all together with _join

us_comp_value <-
    select(us_comp, gvkey, year, total_comp) %>% 
    left_join(
        us_value,
        by = c("year", "gvkey"))
glimpse(us_comp_value)
Rows: 31,692
Columns: 5
$ gvkey        <chr> "001004", "001004", "001004", "001004…
$ year         <dbl> 2011, 2011, 2012, 2013, 2014, 2015, 2…
$ total_comp   <dbl> 5786.400, 5786.400, 4182.832, 5247.77…
$ market_value <dbl> 485.2897, 485.2897, 790.0029, 961.308…
$ ni           <dbl> 67.723, NA, 55.000, 72.900, 10.200, 4…

First plot

plot_comp_value <- ggplot(
    us_comp_value,
    aes(y = total_comp, x = market_value)) +
    geom_point(alpha = .10) +
    ylab("compensation ($ 000)") +
    xlab("market value ($ million)")
print(plot_comp_value)

plot_log <- plot_comp_value +
    scale_x_continuous(
        trans = "log1p",
        breaks = c(1e2, 1e3, 1e4, 1e5, 1e6),
        labels = function(x)
            prettyNum(x/1000, digits = 2)) +
    scale_y_continuous(
        trans = "log1p",
        breaks = c(1e1, 1e2, 1e3, 1e4, 1e5),
        labels = function(x)
            prettyNum(x/1000, digits = 2)) +
    ylab("compensation ($ million)") +
    xlab("market value ($ billion)")
print(plot_log)

plot_zoom <- plot_log +
    coord_cartesian(
        xlim = c(1e1, NA), ylim = c(1e2, NA))
print(plot_zoom)

Linear regression in R

See Chapter 6 of the lecture notes

Notation

\[\begin{equation} y_i = a + b_1 x_{1i} + ... + b_n x_{ni} + \epsilon_i \end{equation}\]

\[\begin{equation} \vec{y} = a + b_1 \vec{x_1} + ... b_n \vec{x_n} + \vec{\epsilon} \end{equation}\]

\[\begin{equation} \vec{y} = a + \vec{b} X + \vec{\epsilon} \end{equation}\]

\[\begin{equation} \vec{y} = \mathcal{N}(a + \vec{b} X, \sigma) \end{equation}\]

See also Chapter 13 in Huntington-Klein (2021)

reg <- lm(y ~ x1 + x2, data = my_data_set)
summary(reg)

Finally, the regression

reg <- lm(log(total_comp + 1) ~ log(market_value + 1),
         data = us_comp_value)
# summary(reg)
print(summary(reg)$coefficients, digits = 2)
                      Estimate Std. Error t value Pr(>|t|)
(Intercept)                5.2     0.0259     201        0
log(market_value + 1)      0.4     0.0032     124        0

CEO Incentives and Size

See Chapter 7 of the lecture notes

Historical Discussion

Our estimates of the pay-performance relation (including pay, options, stockholdings, and dismissal) for chief executive officers indicate that CEO wealth changes $3.25 for every $1,000 change in shareholder wealth (Jensen and Murphy 1990).

[…] The statistic in isolation can present a misleading picture of pay to performance relationships because the denominator - the change in firm value - is so large (Hall and Liebman 1998).

This article addresses four major concerns about the pay of U.S. CEOs: (1) failure to pay for performance; […]. The authors’ main message is that most if not all of these concerns are exaggerated by the popular tendency to focus on the annual income of CEOs (consisting of salary, bonus, and stock and option grants) while ignoring their existing holdings of company equity (Core, Guay, and Thomas 2005).

Stock holding data

us_comp <- readRDS(here("data", "us-compensation-new.RDS")) %>%
    rename(total_comp = tdc1, shares = shrown_tot_pct) %>%
    select(gvkey, execid, year, shares, total_comp)
us_value <- readRDS(here("data", "us-value-new.RDS")) %>%
    rename(year = fyear, market_value = mkvalt)
us_comp_value <- left_join(
    us_comp, us_value, by = c("year", "gvkey")) %>%
    filter(!is.na(market_value) & !(is.na(shares))) %>%
    mutate(wealth = shares * market_value / 100)
glimpse(us_comp_value)
Rows: 21,262
Columns: 7
$ gvkey        <chr> "001004", "001004", "001004", "001004", "001004", "001004…
$ execid       <chr> "09249", "09249", "09249", "09249", "09249", "09249", "09…
$ year         <dbl> 2011, 2012, 2013, 2014, 2015, 2016, 2017, 2018, 2019, 202…
$ shares       <dbl> 2.964, 2.893, 3.444, 3.877, 4.597, 5.417, 3.718, 1.277, 1…
$ total_comp   <dbl> 5786.400, 4182.832, 5247.779, 5234.648, 4674.464, 6072.59…
$ market_value <dbl> 485.2897, 790.0029, 961.3080, 1046.3954, 842.5112, 1200.3…
$ wealth       <dbl> 14.3839867, 22.8547839, 33.1074475, 40.5687497, 38.730239…

Shares to Market Value

plot_shares <- ggplot(
    data = us_comp_value,
    aes(x = market_value/1000, y = shares)) +
    geom_point(alpha = .10) +
    ylab("CEO Ownership") +
    xlab("Firm Market Value (in Billions)") +
    scale_x_continuous(
        trans = "log",
        labels = function(x)
            prettyNum(x, digits = 2),
        breaks =
            scales::log_breaks(n = 5,
                               base = 10)) +
    scale_y_continuous(
        trans = "log",
        labels =
            function(x)
                prettyNum(x, digits = 2),
        breaks =
            scales::log_breaks(n = 5,
                               base = 10))
print(plot_shares)

Pay to Performance Sensitivity

us_sens <- us_comp_value %>%
    group_by(gvkey, execid) %>%
    arrange(year) %>%
    mutate(prev_market_value = lag(market_value),
            prev_wealth = lag(wealth)) %>%
    ungroup() %>%
    mutate(change_log_value = log(market_value) - log(prev_market_value),
           change_log_wealth = log(wealth) - log(prev_wealth)) %>%
    filter(!is.infinite(change_log_wealth)) %>%
    arrange(gvkey)
plot_hypothesis <- ggplot(
    us_sens,
    aes(y = change_log_wealth / change_log_value,
        x = market_value/1000)) +
  geom_point(alpha = .1) +
  scale_x_continuous(
    trans = "log", 
    breaks = scales::log_breaks(n = 5, base = 10),
    labels = function(x) prettyNum(x, dig = 2)) +
  coord_cartesian(
    ylim = c(-10, 10)) +
  xlab("market value") +
  ylab("sensitivity")
print(plot_hypothesis)

p-values

Definition

Assuming the null hypothesis is true, how likely is it to get an estimate that is as extreme as the one we have in our data.

Randomisation or Permutation Test

data_hypo <- us_sens %>%
    mutate(
      sensitivity = change_log_wealth / change_log_value) %>%
  select(sensitivity, market_value) %>%
  filter(complete.cases(.))

observed_cor <- cor(
  data_hypo$sensitivity, data_hypo$market_value)

random_cor <- cor(
  data_hypo$sensitivity, sample(data_hypo$market_value))

print(prettyNum(c(observed_cor, random_cor), dig = 3))
[1] "-0.00192" "0.00512" 
simulate_cor <- function(data){
    return(cor(data$sensitivity,
               sample(data$market_value)))}
rand_cor <- replicate(1e4,
                      simulate_cor(data_hypo))
hist_sim <- ggplot(
    mapping = aes(
        x = rand_cor,
        fill = abs(rand_cor) < abs(observed_cor))) +
    geom_histogram(bins = 1000) +
    xlab("Random Correlations") +
    scale_fill_manual(values = c(uwa_blue, uwa_gold)) +
    theme(legend.position = "none") +
    coord_cartesian(
        xlim = c(-0.1, 0.1))
plot(hist_sim)

Bootstrap

calc_corr <- function(d){
  n <- nrow(d)
  id_sample <- sample(1:n, size = n,
                      replace = TRUE)
  sample <- d[id_sample, ]
  corr <- cor(sample$sensitivity,
              sample$market_value)
  return(corr)
}
boot_corr <- replicate(
    2000, calc_corr(data_hypo))
plot_boot <- ggplot(
    mapping = aes(x = boot_corr)) +
  geom_histogram(bins = 100, colour = uwa_blue,
                 fill = uwa_blue) +
    geom_vline(aes(xintercept = 0),
               colour = uwa_gold) +
    xlab("Bootstrapped Correlation")
print(plot_boot)

Comparison

Permutation Test

  • Calculate the observed statistic
  • Randomly resample the data by breaking the relation you want to test (= Null Hypothesis)
  • Calculate the statistic for each random sample
  • Is the observed statistic more extreme than the randomly resampled statistic?

See also Chapter 4.2 in Cunningham (2021)

Bootstrap

  • Randomly sample observed observations with replacement.
  • Calculate the statistic you are interested in.
  • Is the distribution of resampled statistics unlikely to be 0 (= Null Hypothesis)?

See also Chapter 15 in Huntington-Klein (2021)

Formula Based P-value

cor <- cor.test(data_hypo$sensitivity, data_hypo$market_value)
pvalue_cor <- cor$p.value
print(prettyNum(pvalue_cor, dig = 2))
[1] "0.81"
regr_sens <- lm(sensitivity ~ I(market_value/1e3), data = data_hypo)
coefficients(summary(regr_sens)) %>% print(dig = 2)
                     Estimate Std. Error t value Pr(>|t|)
(Intercept)            1.3712      1.024    1.34     0.18
I(market_value/1000)  -0.0037      0.015   -0.24     0.81

Assignment 1: Plots and regressions

Models

Signaling Model

Peacock’s tail as a signal

Cheap Talk Model

Assumptions are important

Answers

N <- 1000
high_performance <- rbinom(.x, .y, .z)
donation <- ifelse(.x, 1, 0)
return <- ifelse(donation == 1, .y, .z)
observed_donation <- ifelse(rbinom(N, 1, .9) == 1, donation, 1 - donation)
observed_return <- ... 
sig <- tibble(return = ...,
              donation = ...) %>%
    mutate(donated = ...)
glimpse(sig)
sig_plot <- ggplot(..., aes(x = .x, y = .y)) +
    geom_jitter(width = .3)
plot(sig_plot)
sig_reg <- lm(..., data = sig)
summary(...)

References

Core, John E., Wayne R. Guay, and Randall S. Thomas. 2005. “Is U.S. CEO Compensation Broken?” Journal of Applied Corporate Finance 17 (4): 97–104. https://doi.org/10.1111/j.1745-6622.2005.00063.x.
Cunningham, Scott. 2021. Causal Inference: The Mixtape. Causal Inference. Yale University Press. https://doi.org/10.12987/9780300255881.
Edmans, Alex, and Xavier Gabaix. 2016. “Executive Compensation: A Modern Primer.” Journal of Economic Literature 54 (4): 1232–87.
Hall, Brian J., and Jeffrey B. Liebman. 1998. “Are CEOs Really Paid Like Bureaucrats?” The Quarterly Journal of Economics 113 (3): 653–91. https://doi.org/10.1162/003355398555702.
Huntington-Klein, Nick. 2021. The Effect: An Introduction to Research Design and Causality. First. Boca Raton: Chapman and Hall/CRC. https://doi.org/10.1201/9781003226055.
Jensen, Michael C., and Kevin J. Murphy. 1990. “Performance Pay and Top-Management Incentives.” Journal of Political Economy 98 (2): 225–64. https://doi.org/10.1086/261677.
Tervio, Marko. 2008. “The Difference That CEOs Make: An Assignment Model Approach.” American Economic Review 98 (3): 642–68. https://doi.org/10.1257/aer.98.3.642.